While stock markets rally, EIA data tells a different story.
The Persian Gulf has lost 7.6 million barrels per day of production —
and 22 million more remain trapped behind the Strait of Hormuz.
The numbers markets don’t see yet
One month into the crisis, data from the EIA (US Department of Energy)
confirms what oil prices are only beginning to reflect.
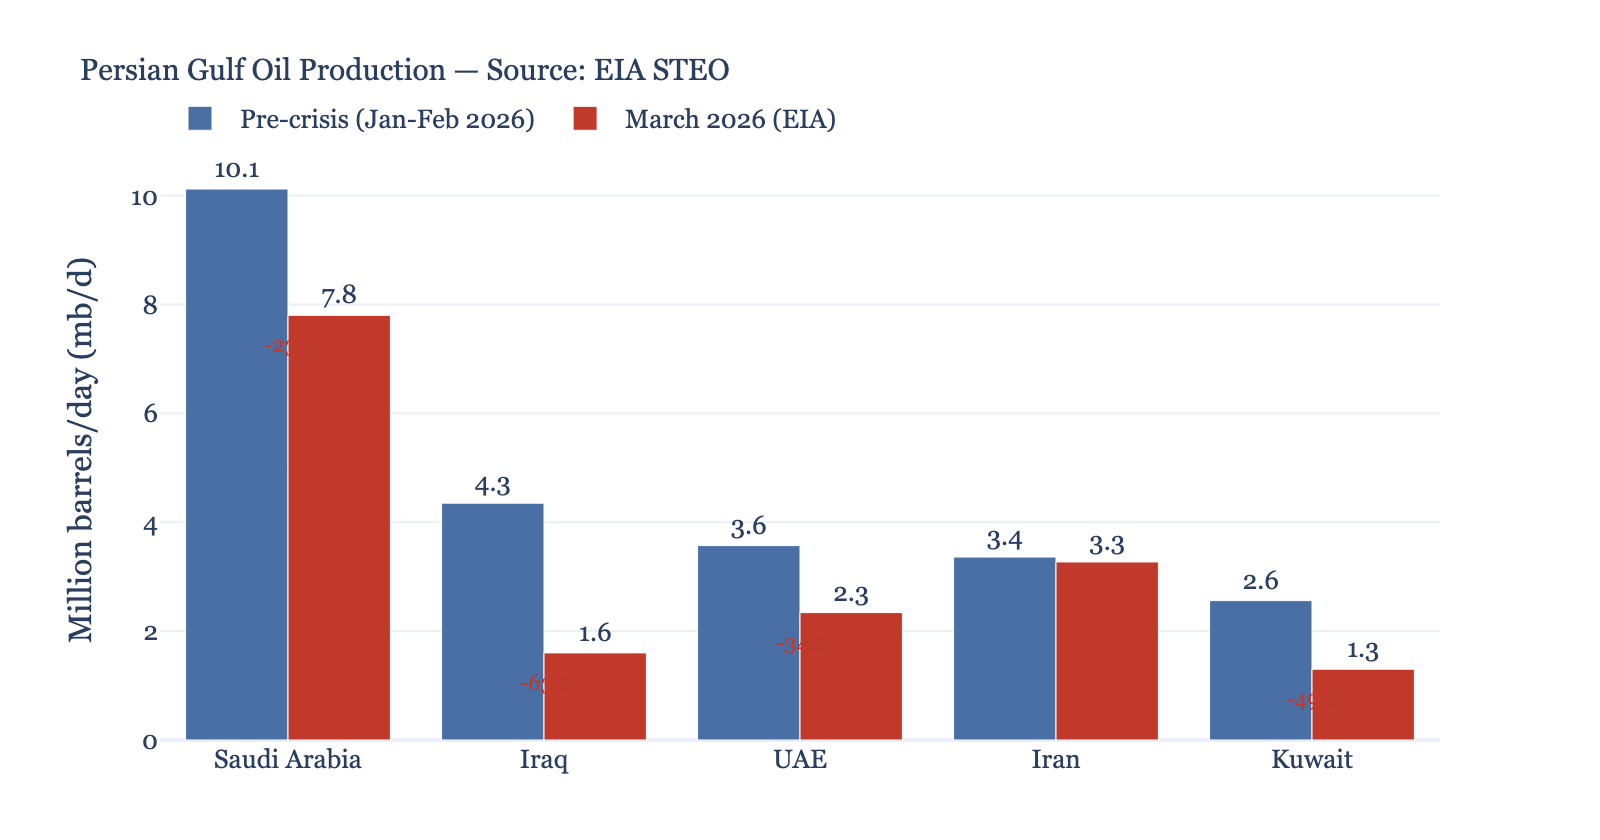
Iraq has lost 63% of its production. Kuwait 49%.
Saudi Arabia, still producing 7.8 mb/d, cannot export most of its crude:
the Strait of Hormuz is closed.
Iran, which closed the Strait, has lost only 3% of production.
Whoever holds the key to the passage doesn’t suffer from the blockade.
Two blackmails, one structure
The Hormuz crisis is a physical blackmail: 22 million barrels per day
of blocked transit. It costs nothing to maintain — just don’t open the Strait.
Whoever controls the passage dictates the terms.
On the other side of the world, American tariffs are a financial blackmail:
those who don’t accept the conditions get excluded from the dollar system.
It costs little to impose — tariffs are paid by consumers in the short term,
but restructure value chains in the long term.
The symmetry is instructive. In both cases, the “free world market” reveals
what it has always been: a system of controlled chokepoints
— physical and financial — where whoever holds the key dictates terms.
Hormuz and the dollar are the same thing: bottlenecks.
What comes next
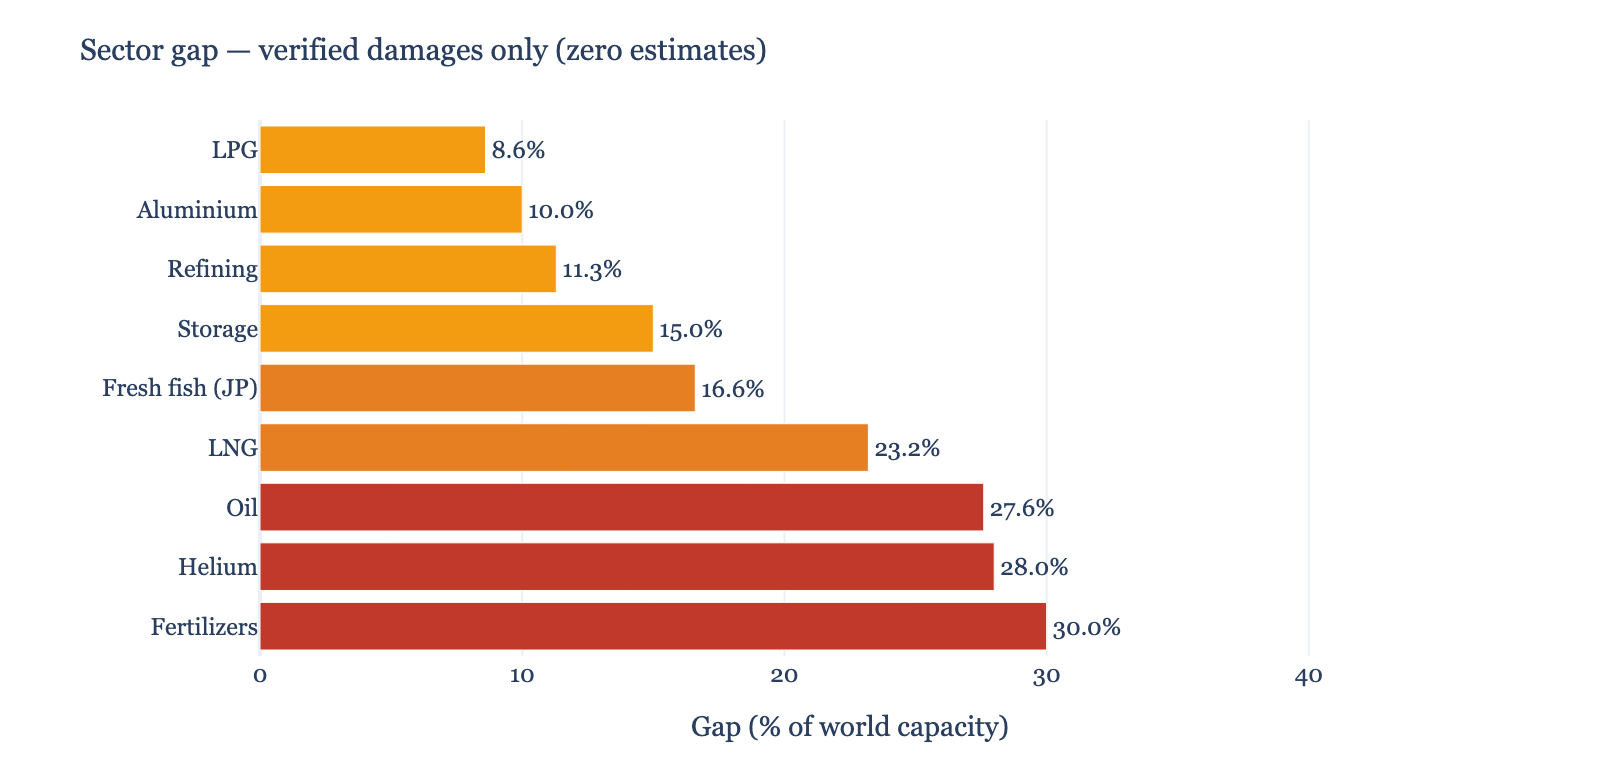
Sector gaps are calculated exclusively from verified damages:
27.6% of world oil, 23.2% of LNG,
30% of global fertilizers. Not estimates — physically destroyed or blocked capacity.
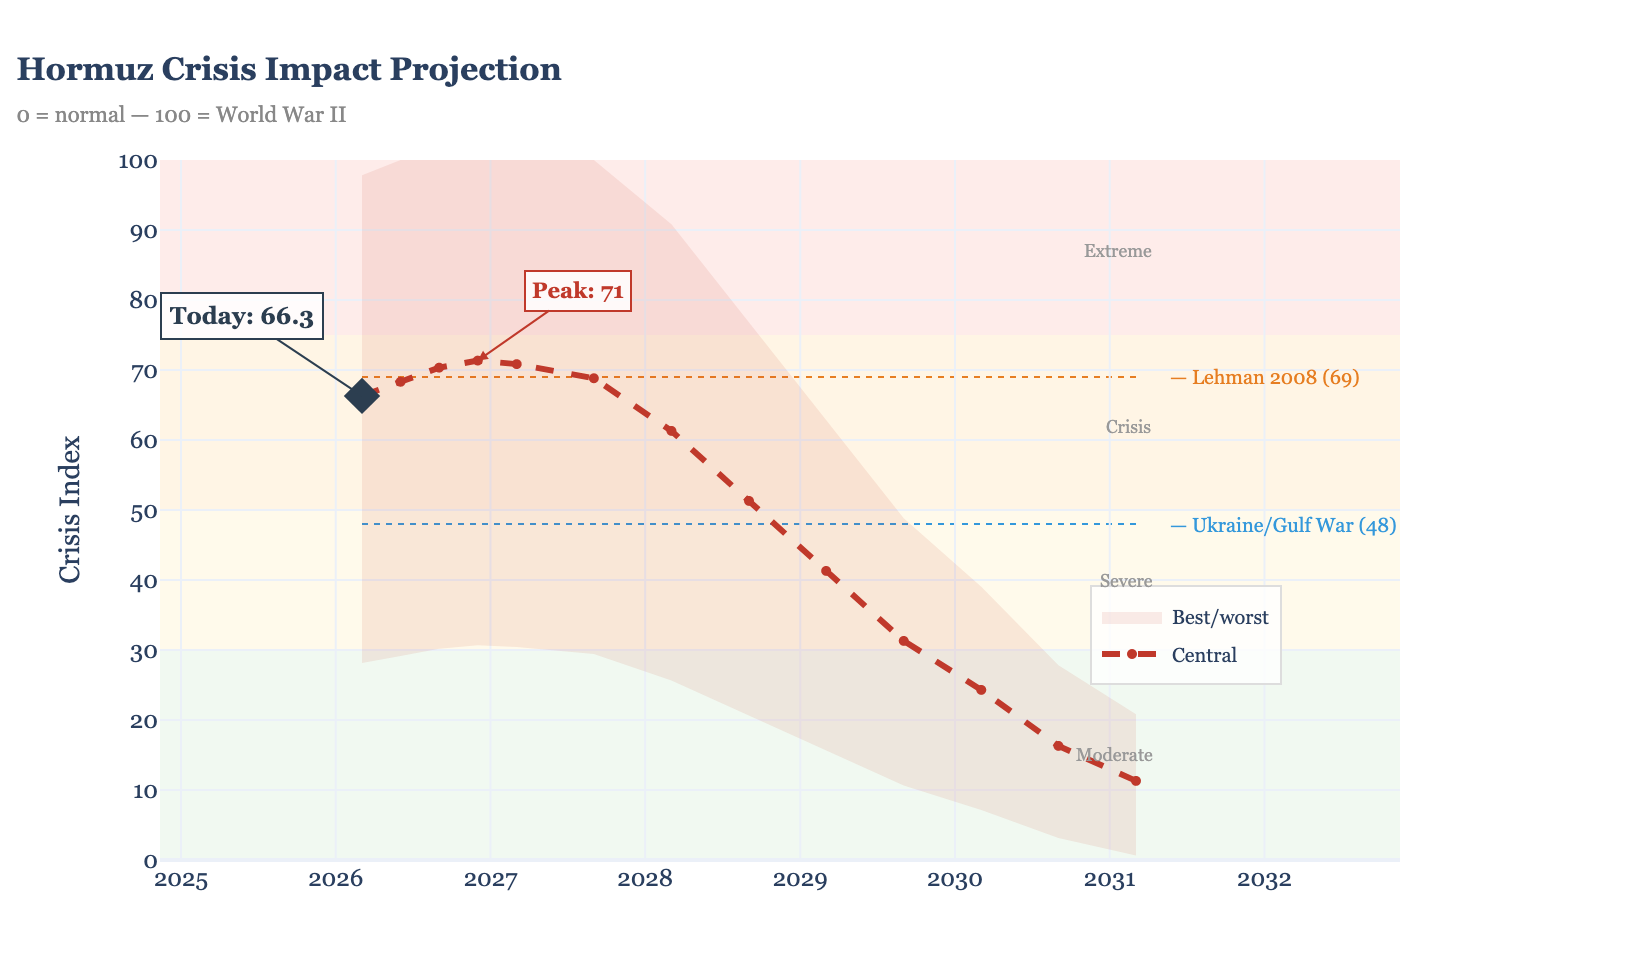
With current damages alone and no new events,
the central projection brings the crisis index to 71 by December 2026.
Not because something new happens, but because the inertia of the energy shock
takes 6-9 months to reach food and industrial prices.
Stock markets, meanwhile, have rallied. The S&P 500 is above its 250-day moving average
with VIX at 21. Markets price yesterday’s earnings and today’s rates.
Tomorrow’s energy and food haven’t arrived yet.
Can Russia compensate?
No. EIA data shows Russia stable at 9.1 mb/d — no increase since March.
It is already at maximum exportable capacity with existing infrastructure.
Substitution will come from strategic reserves (SPR, 6 months),
demand destruction, and in 12-24 months, US shale.
Verified damage timeline
The registry documents 68 verified events dal 1° marzo 2026,
of which 13 with quantified capacity impact and 34 attacks on commercial vessels.
Energy infrastructure
| Date | Target | Detail | Impact |
|---|---|---|---|
| 2026-03-04 | 🔴 Stretto di Hormuz | Iran dichiara chiusura dopo strikes USA-Israele (Khamenei ucciso 28 fe | 22.0 mb/d |
| 2026-03-04 | 🟡 Iraq produzione petrolifera | Produzione -70%: da 4.3 a 1.3 mb/d | 3.0 mb/d |
| 2026-03-04 | 🟠 Dubai International Airport and Abu Dhabi | Dubai e Abu Dhabi hanno subito danni da attacchi iraniani a infrastrut | |
| 2026-03-04 | 🟠 Kuwait | Aerei in Kuwait sono stati messi a terra dopo colpi agli aeroporti | |
| 2026-03-05 | 🟠 Naphta terminal at the port of Kharg island | — | |
| 2026-03-08 | 🟠 Saudi Aramco’s Abqaiq processing facility | — | |
| 2026-03-09 | 🟠 Bahrain — Al Ma’ameer (Bapco) | Complesso petrolifero colpito, incendio, Bapco dichiara force majeure | 267K bpd |
| 2026-03-09 | 🟠 Port of Fujairah | — | |
| 2026-03-10 | 🟠 Ras Laffan (Qatar LNG) — 2 treni LNG | Missili su 2 treni LNG — 12.8 mtpa capacita’ danneggiata, 17% export Q | 12.8 mtpa LNG |
| 2026-03-10 | 🟠 Ras Laffan (Qatar) — Pearl GTL | Impianto Gas-to-Liquids colpito separatamente, danni estesi | |
| 2026-03-10 | 🟠 Qatari Energy giant QatarEnergy’s oil facilit | — | |
| 2026-03-11 | 🟠 Qaem Ensam Oil Refinery | — | |
| 2026-03-14 | 🟠 Fujairah Oil Terminal (UAE) | Drone — 3 tank distrutti (satellite confermato), ~3M bbl capacita’ sto | |
| 2026-03-15 | 🟡 Bab al-Mandeb | Attacchi Houthi intensificati — bypass Yanbu non affidabile | 2.6 mb/d |
| 2026-03-15 | 🟠 QatarEnergy | Dichiarazione di forza maggiore su tutte le esportazioni di LNG | |
| 2026-03-16 | 🟠 South Pars oil field | — | |
| 2026-03-17 | 🟠 Kuwait and Qatar | Attacchi iraniani a impianti di dissalazione, fonte del 99% dell’acqua | |
| 2026-03-18 | 🟠 Qatar’s inactive Ras Laffan Industrial City L | Hit, causing 17% reduction in LNG production capacity. Repair estimate | |
| 2026-03-18 | 🟠 Kharg Island Oil Terminal | — | |
| 2026-03-20 | 🟠 Kuwait — Raffineria Al-Ahmadi | Drone strikes — incendi in unita’ operative | 200K bpd |
| 2026-03-26 | 🟠 Qatar — Ras Laffan Industrial City LNG comple | Iranian missile strikes damage Ras Laffan Industrial City LNG complex | |
| 2026-03-29 | 🟠 UAE Abu Dhabi — EGA Alluminio + Bahrain Alba | IRGC attacca impianti alluminio UAE+Bahrain. EGA Abu Dhabi danni signi | |
| 2026-03-30 | 🟠 Kuwait — Impianto dissalazione + centrale | Attacco iraniano su impianto dissalazione acqua + centrale elettrica. | |
| 2026-04-02 | 🟠 Saudi Arabia – oil field in Ras Al Khair | Saudi oil field damaged in Ras Al Khair | |
| 2026-04-03 | 🟠 Kuwait — Raffineria + Dissalazione (2o attacc | Secondo attacco su raffineria Al-Ahmadi + impianto dissalazione. Confe | 100K bpd |
| 2026-04-07 | 🟠 Hormuz Strait, commercial shipping | Failed UN resolution aimed at protecting commercial shipping | |
| 2026-04-08 | 🟠 East-West oil pipeline, Saudi Arabia | Pipeline hit in Iranian attack | |
| 2026-04-09 | 🟠 Port of Dubai, UAE — Al Salmi | Danni al container port e al terminal |
Attacks on commercial vessels
34 vessels struck in the Strait and Persian Gulf.
Almeno 5 sunk or abandoned with crew casualties.
Tankers, container ships, tugs, LNG carriers.
The full list includes: MT Skylight north of Khasab, MKD VYOM, LCT Ayeh, MT Hercules Star, Ocean Electra, Stena Imperative, Athe Nova, Gold Oak, Libra Trader, Safeen Prestige, Sonangol Namibe, Mussafah 2 (Tugboat), Arabia III – Arabian Gulf, Louise P, Express Rome, One Majesty, MV Mayuree Naree, Star Gwyneth, Safesea Vishnu, Zefyros.
🔴 Ongoing 🟠 Damaged 🟡 Disrupted.
Registry auto-updated from 9 OSINT sources (gCaptain, ISW, CSIS, UKMTO, Wikipedia)
with LLM verification and geographic quality filter.
Who pays — and how much
If the Hormuz blockade persists, the impact will not be uniform.
The estimates below are conditional projections: they assume the current blockade
continues with no new events and no reopening of the Strait.
| Country/Region | Hormuz Dependency | Expected impact 6-12 months |
|---|---|---|
| Japan | 88% oil | Released 80M bbl SPR (45 days). Coal from Australia. Investing in Alaska. Iran offered transit to Japanese ships — Tokyo officially declined (US pressure). Gasoline +31%, fish -30% supply, kerosene +29%. |
| South Korea | 75% oil | Same structure as Japan, fewer strategic reserves. Nuclear acceleration. |
| India | 60% oil | 90-day reserves. Partial wheat/rice self-sufficiency. Increased Russian imports. But fertilizers +40% — kharif 2026 harvest at risk. |
| Egypt | Fertilizers | Urea from $490 to $700/t (+28%). Shifted from gas exporter to net importer. Imported wheat vulnerable. Bread subsidy under fiscal pressure. |
| Sub-Saharan Africa | 80% fert. imports | WFP estimates 45 million additional people facing acute hunger if the blockade lasts through June. Fertilizers unreachable during planting season. Sudan, Kenya, Somalia worst hit. |
| Bangladesh/Pakistan | 55% oil, 70% fert. | Simultaneous currency + energy + food crisis. Rice +12%. Political instability risk. |
| EU/Europe | 15% oil | Gas via pipeline (Norway, residual Russia). SPR reserves. CAP agricultural policy. Moderate food inflation (+5-8%). Indirect impact: migration pressure from Africa and Middle East if food crisis materializes. |
| USA | 5% oil | Energy self-sufficient. Food surplus. SPR 700M bbl. Near-zero impact on domestic consumption. |
Conditional estimates assuming current blockade persists.
Sources: EIA STEO, FAO, WFP, Carnegie Endowment, CFR.
One third of globally traded fertilizers transit through Hormuz (FAO).
Sources: EIA Short-Term Energy Outlook (api.eia.gov),
verified damage registry (68 events, 13 with quantified impact),
GPR Index (Caldara-Iacoviello, Federal Reserve),
e-Stat Japan, Yahoo Finance.
All data and projections derived from publicly verifiable sources.
Price projections assume persistence of current damages with no new events.